序言
人非圣贤,孰能无过?
对程序而言,同样如此,即使一个产品经历了一系列的开发测试工作,在此过程中又遇到并解决了成百上千个 Bug,最终交付给客户并正式上线了,后期还是可能会出现一些问题。
这些问题的产生,可能是客户进行了不符合逻辑的异常操作引起的,也可能是程序代码原先判断逻辑本就存在问题,还有可能是某个应用或服务器资源(CPU、内存、磁盘、网络)出现异常了。但不管怎样,是问题就应当给客户解决,不然客户不满意了,公司的企业形象降低了,若后期还有合作,说不定就泡汤了呢!合作泡汤了,说不定整个业务部门就给你优化掉,程序员就没班上了呢!!!
作为程序员,为了防止被优化的意外发生,还是老老实实的帮客户解决问题吧!
那么,怎么去解决问题呢?
作为一个程序员,接到一个产品问题,想的应该不是解决,而是分析问题的类型,待分析出问题的类型后,才去解决问题。
那么,问题大概又可以分为哪几种类型呢?
笔者认为,其大致可以分为以下三种:
- ① 理解问题:做的需求不符合客户的预期效果,客户不买帐,那么,互相扯皮或者重新做~
- ② 代码问题:程序存在 Bug,这又进一步可以分为三种:
- 前端 Bug:前端程序问题,页面设计不合理或与后端对接不正确
- 后端 Bug:后端程有问题,逻辑错误或重大 Bug 导致应用的宕机,那么让后端同学修复
- 运维 Bug:服务器配置问题,让实施同学(通常被后端同学替代…)解决
- ③ 服务器问题:CPU、内存、磁盘,网络资源引起的问题
现在,我们得到了一个结论——问题的存在形式是多种多样的,因此我们遇到问题不能局限在某一块思考(后端开发不能碰到问题就想的是看日志,得明确是后端问题才去看日志),因为不同的问题解决方案也不一样。
由于只有在大致分析出问题的类型后,才能尝试去解决问题:
- 针对问题 ①,我们有时可以甩锅给产品同学——你的需求不对呀,我肯定做错呀(叉腰:理直气壮),当然有时也需要自己接锅(自己理解不到位)
- 针对问题 ②,通常需要看线上日志来定位问题的产生原因,尝试复现 Bug
- 针对问题 ③,需要去看服务器某段运行时间里资源情况(注意哦,是观测服务器在某段运行时间里资源情况,因为线上出问题了,肯定是之前某个时间点出的问题,我们仅仅观察出错后的资源占比情况不一定能找出问题所在)
那么,又该如何去观察服务器在某段运行时间里的资源情况是怎样的呢?
这个时候,就需要布置一套监控系统来辅助我们程序员观察分析了。
选择哪种监控系统?
在《SRE: Google 运维解密》一书中指出,监控系统需要能够有效的支持白盒监控和黑盒监控。通过白盒能够了解其内部的实际运行状态,通过对监控指标的观察能够预判可能出现的问题,从而对潜在的不确定因素进行优化。而黑盒监控,常见的如 HTTP 探针,TCP 探针等,可以在系统或者服务在发生故障时能够快速通知相关的人员进行处理。通过建立完善的监控体系,从而达到以下目的:
- 长期趋势分析:通过对监控样本数据的持续收集和统计,对监控指标进行长期趋势分析。例如,通过对磁盘空间增长率的判断,我们可以提前预测在未来什么时间节点上需要对资源进行扩容。
- 对照分析:两个版本的系统运行资源使用情况的差异如何?在不同容量情况下系统的并发和负载变化如何?通过监控能够方便的对系统进行跟踪和比较。
- 告警:当系统出现或者即将出现故障时,监控系统需要迅速反应并通知管理员,从而能够对问题进行快速的处理或者提前预防问题的发生,避免出现对业务的影响。
- 故障分析与定位:当问题发生后,需要对问题进行调查和处理。通过对不同监控监控以及历史数据的分析,能够找到并解决根源问题。
- 数据可视化:通过可视化仪表盘能够直接获取系统的运行状态、资源使用情况、以及服务运行状态等直观的信息。
对于常用的监控系统,如 Nagios、Zabbix 的用户而言,往往并不能很好的解决上述问题
Prometheus 是一个开源的完整监控解决方案,其对传统监控系统的测试和告警模型进行了彻底的颠覆,形成了基于中央化的规则计算、统一分析和告警的新模型。 相比于传统监控系统Prometheus具有以下优点:
- 易于管理
- 监控服务的内部运行状态
- 强大的数据模型
- 强大的查询语言 PromQL
- 高效
- 可扩展
- 易于集成
- 可视化
- 开放性
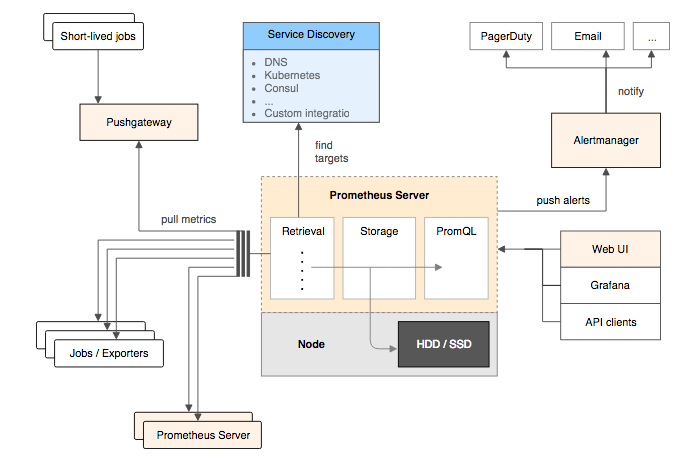
监控系统的角色组成
一个完整的全链路监控系统,通常而言需要以下角色组件互相配合工作:
- ① 客户端:确认要监控的指标数据,进行埋点暴露工作
- ② 收集器:定时拉取(或客户端推送)埋点暴露的指标数据,存储到相关数据库
- ③ 告警中心:监控数据出现异常时发送通知(短信、邮件等)告知相关处理人员
- ④ UI 界面:
- 将指标查询计算后,将其以图表方式展现,供程序人员分析
- 配置告警任务,对特定指标进行阈值配置,超过限制以短信邮件等形式通知维护人员
Prometheus 同样遵循此种架构,通过以下组件架构协调工作:
- Prometheus Server:Prometheus 组件中的核心部分,负责实现对监控数据的获取,存储以及查询
- Exporters:将监控数据采集的端点通过 HTTP 服务的形式暴露给 Prometheus Server,Prometheus Server 通过访问该 Exporter 提供的 Endpoint 端点,即可获取到需要采集的监控数据
- Prometheus Server + AlertManager:告警处理中心,定义告警规则,规则触发后经过处理发送通知给用户
- Grafana:UI 界面
Exporters —— 客户端组件
我们需要监控什么样的指标数据?
- MySQL 应用的健康情况,Buffer Pool?
- Reids 应用的健康情况,内存使用量?
- Linux 服务器的 CPU,磁盘容量,网络,内存情况?
- Java 应用的健康情况,接口的调用情况?
它们也都有可能,那么自然需要为不同的服务适配不同的客户端去获取不同的指标信息,因此,已有前行者为我们开发好了对应的客户端工具,此类工具被称为 Exporter。
Exporter 将监控数据采集的端点通过 HTTP 服务的形式暴露给 Prometheus Server,Prometheus Server 通过访问该 Exporter 提供的 Endpoint 端点,即可获取到需要采集的监控数据。
一般来说可以将 Exporter 分为两类:
- 直接采集:这一类 Exporter 直接内置了对 Prometheus 监控的支持,比如 cAdvisor,Kubernetes,Etcd,Gokit 等,都直接内置了用于向 Prometheus 暴露监控数据的端点
- 间接采集:间接采集,原有监控目标并不直接支持 Prometheus,因此我们需要通过 Prometheus 提供的 Client Library 编写该监控目标的监控采集程序。例如: Mysql Exporter,JMX Exporter,Consul Exporter 等
我们可能需要监控什么服务?
MySQL?Redis?Linux 服务器?还是 Java 应用?
它们都有可能。
比如:
node_exporter:主机监控客户端redis_export:Redis 监控客户端mysql_export:MySQL 监控客户端
node_exporter
node_exporter用来监控主机信息,每台机器上都要部署一个该组件
1 | tar -zxvf node_exporter-1.3.1.linux-amd64.tar.gz |
启动成功后,可通过访问http://{ip}:9100/metrics查看监控信息,有监控指标输出即为部署成功。
推荐中文看板 ID:8919 或 11174
redis_export
redis_export 用来监控 redis 服务器的信息,每台部署 redis 的机器上都要部署一个该组件:
1 | tar -zxvf redis_exporter-v1.37.0.linux-amd64.tar.gz |
启动成功后,可通过访问http://{ip}:9122/metrics查看监控信息,有监控指标输出即为部署成功。
推荐中文看板 ID:17507
mysql_export
mysql_export用来监控 MySQL 服务器的信息,每台部署 MySQL 的机器上都要部署一个该组件
1 | tar -xf mysqld_exporter-0.12.1.linux-amd64.tar.gz |
进入目录,修改my.cnf文件,填写 MySQL 数据库的用户名、密码
1 | [client] |
之后通过以下命令启动:
1 | nohup ./mysqld_exporter --config.my-cnf=my.cnf --web.listen-address=":9104" > /dev/null 2>&1 & |
启动成功后,可通过访问 http://{ip}:9104/metrics 查看监控信息,有监控指标输出即为部署成功。
推荐看板ID:7362 17320(中文推荐)
kafka_export
kafka_export用来监控 kafka 服务器信息,每台部署 kafka 的机器上都要部署一个该组件
1 | tar -xf kafka_exporter-1.2.0.linux-amd64.tar.gz |
启动成功后,可通过访问 http://{ip}:9308/metrics 查看监控信息,有监控指标输出即为部署成功。
推荐中文看板 ID:12326、11285、12460
elasticsearh_export
elasticsearch_export 用来监控 es 服务器信息,每台部署 es 的机器上都要部署一个该组件
解压【elasticsearch_exporter-1.0.4rc1.linux-amd64.zip】压缩文件到指定目录
通过修改 elasticsearch_export.sh 脚本来配置要监控的es机器,或者是修改端口号
1 | tar -xf elasticsearch_exporter-1.0.4rc1.linux-amd64.tar.gz |
启动成功后,可通过访问 http://{ip}:9109/metrics 查看监控信息,有监控指标输出即为部署成功。
Java 客户端——Spring Boot Actuator
Spring Boot 的 Actuator 模块可以帮助我们监控和管理 Spring Boot 应用。
那么,为了达到此目的,Actuator 又会如何做呢?
简单来讲,Actuator 模块内部会对启动的应用进行以下四个动作:
- ① 查看特定信息;
- ② 收集特定信息;
- ③ 暴露特定信息;(核心)
- ④ 处理特定信息(偶尔使用)
这些被 Actuator 查看并被收集的特定信息一般包括:
- 健康情况:应用的存活情况
- 指标:应用的指标信息,收集后主要供其他监控系统(比如 Prometheus)使用
logger:应用程序的日志级别,允许热修改哦- HTTP 跟踪:存储应用最近 100 个请求-响应交换的跟踪信息
在收集到这些信息后,Actuator 模块会将其采集并暴露给外界。
对外界而言,必定需要通过某种方式来访问这些信息,Actuator 则提供了两种方式:
- HTTP
- JMX
快速入门
若想使用 Actuator 模块,只需在 Spring Boot 项目中的pom.xml文件加入以下依赖即可:1
2
3
4
5<!-- 监控 -->
<dependency>
<groupId>org.springframework.boot</groupId>
<artifactId>spring-boot-starter-actuator</artifactId>
</dependency>
之后便可通过http://ip:port/actuator访问。
Endpoints
简介中提到过,Actuator 会暴露收集的一些信息,供外界通过 HTTP 或 JMX 访问。
在 Actuator 中,这些被暴露的不同类别的信息被不同的 Endpoints(以下简称端点)统领。
种类
不同的端点会提供不同的信息,比如说:
/health端点: 提供了关于应用健康情况的一些基础信息/metrics端点:提供了一些有用的应用程序指标(JVM 内存使用、系统 CPU 使用等)
这些 Actuator 模块自带的端点被称之为原生端点。
根据端点的作用,可以将其分为三大类:
- 应用配置类:获取应用程序中加载的应用配置、环境变量、自动化配置报告等与 Spring Boot 应用密切相关的配置类信息
- 度量指标类:获取应用程序运行过程中用于监控的度量指标,比如:内存信息、线程池信息、HTTP 请求统计等。
- 操作控制类:提供了对应用的关闭等操作类功能。
列表
下表详细对目前 Actuator 的端点进行了一个说明:
| 端点 | 说明 |
|---|---|
| auditevent | 显示应用暴露的审计事件(比如认证进入、订单失败) |
| beans | 显示应用程序中所有 Spring bean 的完整列表 |
| caches | 暴露可用的缓存 |
| info | 显示应用的基本信息 |
| health | 显示应用的健康状态 |
| metrics | 显示应用多样的度量信息 |
| loggers | 显示和修改配置的 loggers |
| logfile | 返回 logfile 中的内容(若 logging.file 或 logging.path 被设置) |
| httptrace | 显示 HTTP 足迹,最近 100 个 HTTP 请求与响应 |
| env | 显示当前的环境特性 |
| flyway | 显示数据库迁移路径的详细信息 |
| shutdown | 优雅地逐步关闭应用 |
| mappings | 显示所有的@RequestMapping路径 |
| scheduledtasks | 显示应用中的调度任务 |
| threaddump | 显示线程状态信息 |
| heapdump | 返回一个 GZip 压缩的 JVM 堆 dump |
| prometheus | 以 Prometheus 服务器可以抄袭的格式公开指标,需要额外的 micrometer-registry-Prometheus 依赖 |
启用与暴露
Endpoints 存在启用与暴露开关。
如何启用 Endpoints?
默认情况下,除了关闭之外的所有端点都是启用的。
若要配置端点的启用,需使用management.endpoint.<id>.enabled启用属性。
下面的示例启用了关闭端点:1
management.endpoint.shutdown.enabled=true
如何暴露 Endpoints?
因为 Endpoints 可能包含敏感信息,所以应该仔细考虑何时公开它们。
默认暴露
下表显示了默认暴露的内置端点:
| ID | JMX | Web |
|---|---|---|
auditevents |
是 | 否 |
beans |
是 | 否 |
caches |
是 | 否 |
conditions |
是 | 否 |
configprops |
是 | 否 |
env |
是 | 否 |
flyway |
是 | 否 |
health |
是 | 是 |
heapdump |
无 | 否 |
httptrace |
是 | 否 |
info |
是 | 是 |
integrationgraph |
是 | 否 |
jolokia |
无 | 否 |
logfile |
无 | 否 |
loggers |
是 | 否 |
liquibase |
是 | 否 |
metrics |
是 | 否 |
mappings |
是 | 否 |
prometheus |
无 | 否 |
scheduledtasks |
是 | 否 |
sessions |
是 | 否 |
shutdown |
是 | 否 |
threaddump |
是 | 否 |
自定义暴露
若要更改公开的端点,可使用 include 和 exclude 属性
| 属性 | 默认值 |
|---|---|
management.endpoints.jmx.exposure.exclude |
|
management.endpoints.jmx.exposure.include |
* |
management.endpoints.web.exposure.exclude |
|
management.endpoints.web.exposure.include |
info, health |
简单来讲:
- 可使用端点 id 列表配置 include 和 exclude 属性(多个用
,隔开) - include 属性列出公开的端点的 id
- exclude 属性列出不应公开的端点的 id
- exclude 属性优先于 include 属性
例如,要停止通过 JMX 公开所有端点并仅公开 health 和 info 端点,请使用以下属性:1
management.endpoints.jmx.exposure.include=health,info
*可用于选择所有端点。
例如,若要通过 HTTP 公开除了 env 和 beans 端点以外的所有端点,需这么配置:
1 | management.endpoints.web.exposure.include=* |
路径
Actuator 默认所有的端点路径都在/actuator/*,当然若有需要此路径也可进行如下定制化:
1 | management.endpoints.web.base-path=/minitor |
设置完重启应用后,再次访问地址就会变成/minitor/*。
配置注意
需要注意的是,*在 YAML 文件中存在特殊含义,因此若想包含(或排除)所有端点,请确保添加引号,如下例所示:
1 | management: |
常用 Endpoints
在 Actuator 中,提供了大量的端点,但我们并不需要去了解所有的端点,掌握一些常用的即可。
那么,下面就对这些常用的进行一一介绍。
health
/health端点会聚合你程序的健康指标,来检查程序的健康情况。
端点公开的应用健康信息则取决于下面的属性配置:
1 | management.endpoint.health.show-details=never |
该属性可以使用以下值之一进行配置:
| 属性值 | 说明 |
|---|---|
never |
只显示应用的状态(up 或 down)不展示详细信息,默认值 |
when-authorized |
将详细信息展示给通过认证的用户。授权的角色可以通过management.endpoint.health.roles配置 |
always |
对所有用户暴露详细信息 |
一般保持默认即可。
metrics
/metrics端点用于展示当前应用的各类重要度量指标,比如:内存信息、线程信息、垃圾回收信息、tomcat、数据库连接池等。
1 | { |
不同于 1.x,Actuator 在这个界面看不到具体的指标信息,只是展示了一个指标列表。
为了获取到某个指标的详细信息,我们可以请求具体的指标信息,像这样:
1 | http://localhost:8080/actuator/metrics/{MetricName} |
loggers
info
/info端点可以用来展示你程序的信息。我理解过来就是一些程序的基础信息。并且你可以按照自己的需求在配置文件application.properties中个性化配置(默认情况下,该端点只会返回一个空的json内容):
1 | info.app.name=actuator-test-demo |
启动项目,访问http://localhost:8080/actuator/info:
1 | { |
beans
/beans端点会返回 Spring 容器中所有 bean 的别名、类型、是否单例、依赖等信息。
heapdump
访问:http://localhost:8080/actuator/heapdump 会自动生成一个 JVM 的堆文件 heapdump。我们可以使用 JDK 自带的 Jvm 监控工具 VisualVM 打开此文件查看内存快照。
threaddump
threaddump 主要展示了线程名、线程ID、线程的状态、是否等待锁资源、线程堆栈等信息。
此端点方便我们在日常定位问题的时候查看线程的情况,但可能查看起来不太直观。
访问http://localhost:8080/actuator/threaddump返回如下
shutdown
shutdown端点属于操作控制类端点,可以优雅关闭 Spring Boot 应用。
该功能默认是关闭的,若想启用,需要在配置文件中进行如下配置:
1 | management.endpoint.shutdown.enabled=true |
如何使用它呢?
当我们启动 Demo 项目,可向http://localhost:8080/actuator/shutdown发起POST请求。
请求后将返回如下信息:
1 | { "message": "Shutting down, bye..."} |
最后应用程序将被关闭。
由于开放关闭应用的操作本身是一件非常危险的事,所以不是特别必要的话,不要开启这个端点,若想在线上使用,最好对其加入一定的保护机制,比如:定制 Actuator 的端点路径、整合 Spring Security 进行安全校验 等。
注意点
对端点而言:
- 每一个端点都可以通过配置来单独禁用或者启动
- 不同于 Actuator 1.x,Actuator 2.x 的大多数端点默认被禁掉
- Actuator 2.x 中的默认端点增加了
/actuator前缀 - Actuator 2.x 默认暴露的两个端点为
/actuator/health和/actuator/info
JVM 看板
看板ID:
- 4701(官方 JVM)
- 6756(Java)
- 14430(推荐)
- 16107(中文)
- 13625(中文超全)
- 12900(推荐 SpringBoot)
1 | # instance |
Prometheus Server —— 收集器组件
如何收集存储各服务客户端的指标,这依赖 Prometheus Server。
Prometheus Server 是 Prometheus 组件中的核心部分,除了负责实现对监控数据的获取,存储,还支持特殊规则语法方便查询。
下面为部分配置说明:1
2
3
4
5
6
7
8
9
10
11
12
13
14
15
16
17
18
19
20
21
22
23
24
25
26
27
28
29
30
31
32
33
34
35
36
37
38
39
40
41
42
43
44
45scrape_configs:
# 主机监控
- job_name: "node_export"
static_configs:
- targets:
- "10.57.12.19:9100"
- "10.57.12.20:9100"
- "10.57.12.21:9100"
- "10.57.12.22:9100"
- "10.57.12.23:9100"
- "10.57.12.24:9100"
# MySQL 监控
- job_name: "mysql_export"
static_configs:
- targets:
- "10.57.12.21:9104"
- "10.57.12.22:9104"
# Redis 监控
- job_name: "redis_export"
static_configs:
- targets: ["10.57.12.20:9121"]
# Java 应用监控
- job_name: "gateway"
metrics_path: "/actuator/prometheus"
static_configs:
- targets:
- "10.57.12.20:8080"
- "10.57.12.23:8080"
- "10.57.12.24:8080"
- job_name: "auth"
metrics_path: "/actuator/prometheus"
static_configs:
- targets:
- "10.57.12.20:9200"
- "10.57.12.23:9200"
- "10.57.12.24:9200"
- job_name: "sys"
metrics_path: "/actuator/prometheus"
static_configs:
- targets:
- "10.57.12.20:9201"
- "10.57.12.23:9201"
- "10.57.12.24:9201"
Prometheus + AlertManager —— 告警组件
告警功能在 Prometheus 的架构中,被划分成两个独立的部分,如下图所示:
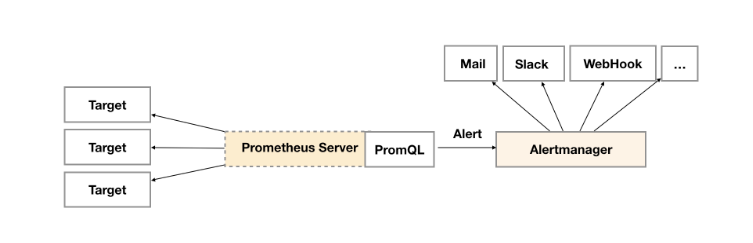
通过在 Prometheus 中定义 AlertRule(告警规则),Prometheus 会周期性的对告警规则进行计算,如果满足告警规则的触发条件,就会向 Alertmanager 发送告警信息。
告警规则
在 Prometheus 中一条告警规则主要由以下几部分组成:
- 告警规则名称:为告警规则命名,对于命名而言,建议能够直接表达出该告警的主要内容
- 告警规则定义:告警规则实际上主要由 PromQL 进行定义,其实际意义是当表达式(PromQL)查询结果持续多长时间(During)后出发告警
- 告警规则分组:对一组相关的告警进行统一定义
以上定义,都是通过 YAML 文件进行统一管理。
告警规则文件的定义
以下是一个告警规则文件的示例:1
2
3
4
5
6
7
8
9
10
11
12
13
14
15
16
17
18
19groups:
- name: example
rules:
# 告警规则的名称
- alert: HighErrorRate
# 基于 PromQL 表达式告警触发条件,用于计算是否有时间序列满足该条件
expr: job:request_latency_seconds:mean5m{job="myjob"} > 0.5
# 评估等待时间,可选参数。用于表示只有当触发条件持续一段时间后才发送告警。在等待期间新产生告警的状态为 pending
for: 10m
# 自定义标签,允许用户指定要附加到告警上的一组附加标签
labels:
# 指定告警级别,存在 warning, critical 和 emergency 三种等级。严重等级依次递增
severity: critical
# 指定一组附加信息,比如用于描述告警详细信息的文字等,此内容在告警产生时会一同作为参数发送到 Alertmanager
annotations:
# 概要信息
summary: High request latency
# 详细信息
description: description info
如何引入告警规则文件
为了能够让 Prometheus 能够启用定义的告警规则,我们需要在 Prometheus 的全局配置文件中通过rule_files指定一组告警规则文件的访问路径,Prometheus 启动后会自动扫描这些路径下规则文件中定义的内容,并且根据这些规则计算是否向外部发送通知:1
2rule_files:
- /etc/prometheus/rules/*.rules
默认情况下Prometheus会每分钟对这些告警规则进行计算,如果用户想定义自己的告警计算周期,则可以通过evaluation_interval来覆盖默认的计算周期:1
2global:
[ evaluation_interval: <duration> | default = 1m ]
告警规则触发后的告警处理
Alertmanager 作为一个独立的组件,负责接收并处理来自 Prometheus Server (也可以是其它的客户端程序)的告警信息。
Alertmanager 主要用于对告警信息进行进一步的处理,比如当接收到大量重复告警时能够消除重复的告警信息,同时对告警信息进行分组并且路由到正确的通知方。
Prometheus 内置了对邮件,Slack 等多种通知方式的支持,同时还支持与 Webhook 的集成,以支持更多定制化的场景。
1 | global: |
常见的监控指标
内存不足
可用内存低于阈值 10% 就会触发告警。1
2
3
4
5
6
7
8- alert: HostOutOfMemory
expr: node_memory_MemAvailable_bytes / node_memory_MemTotal_bytes * 100 < 10
for: 2m
labels:
severity: warning
annotations:
summary: Host out of memory (instance {{ $labels.instance }})
description: "请注意!主机内存不足,当前使用率: {{ $value }}\n LABELS = {{ $labels }}"
磁盘空间不足
1 | - alert: Host out of disk space |
Grafana —— UI 展示组件
如何选择一款功能齐全且界面炫酷的前端监控界面,这可以使用 Grafana。
Docker 快速部署
一般使用 Docker 方式快速部署 Prometheus + Grafana,我们分别配置。
前置配置-时间同步
1 | yum install -y ntpdate |
Prometheus 配置
1 | cd /data/software/monitor/ |
Grafana 配置
1 | mkdir -p grafana/data |
1 | vim /data/software/monitor/grafana/config/grafana.ini |
注意,如果需要外部域名访问,需要修改以下三个配置:1
2
3
4
5
6# 设置自己的域名
domain = demo.leeqingshui.com
# 修改如下
root_url = https://%(domain)s/grafana/
# 设置为 true
serve_from_sub_path = true
1 | sudo chmod -R 777 grafana/ |
AlertManager 配置
1 | mkdir -p alertmanager/config |
webhook-dingtalk
1 | mkdir -p webhook-dingtalk/template |
1 | vim /data/software/monitor/webhook-dingtalk/template/template.tmpl |
1 | sudo chmod -R 777 webhook-dingtalk/ |
Docker Compose 编写
1 | cat >> /data/software/monitor/docker-compose.yml <<EOF |
之后启动即可。
Nginx 配置
在server模块前加上以下配置:1
2
3
4map $http_upgrade $connection_upgrade {
default upgrade;
'' close;
}
在server模块内加上以下配置:1
2
3
4
5
6
7
8
9
10
11
12
13
14
15
16
17location ^~ /grafana/ {
proxy_pass http://172.20.39.22:3000/;
proxy_set_header Host $host;
proxy_set_header X-Real-IP $remote_addr;
proxy_set_header X-Forwarded-Host $host;
proxy_set_header X-Forwarded-Server $host;
proxy_set_header X-Forwarded-For $proxy_add_x_forwarded_for;
}
location /grafana/api/live {
rewrite ^/grafana/(.*) /$1 break;
proxy_http_version 1.1;
proxy_set_header Upgrade $http_upgrade;
proxy_set_header Connection $connection_upgrade;
proxy_set_header Host $http_host;
proxy_pass http://172.20.39.22:3000/;
}
之后重新加载 Nginx 即可。
踩坑-时间同步问题
部署完成后,发现 Prometheus 所有的监控项在 Grafana 页面上均显示无数据,查看 Prometheus 的日志发现,该日志报out of bounds错误。
看到out of bounds,第一感知是Prometheus tsdb存满了,导致数据无法存储;但是,Prometheus 设置了storage.tsdb.retention.time,定期会去清理,理论上是不应该出现tsdb存满的情况。
接下来进入 Prometheus 的 tsdb 存储路径看下,发现其block和wal目录的更新时间全部为 2029 年;然而查看当前服务器时间却是与本地同步的,所以现在可以确认的是之前服务器时间是被修改过的。
到此,结合 Prometheus tsdb 存储原理也就能解释清楚为什么出现了out of bounds的原因了
当第一次更改服务器时间为 2029 年,那么 tsdb 时间序列即从当前时间直接跳转到 2029 年开始存储,如果一直保持这样下去,也不会出现什么大问题,顶多时间序列会出现断裂,即当前时间序列对应的metric查出来是no data.
然而,又把服务器时间与本地做了同步,时间序列从 2029 年一下子回到了 2023 年,那么当每次向 tsdb 存数据的时候,发现最近一次的时间序列大于当前的时间序列,无法满足 tsdb 递增存储时间序列的原,所以就爆了out of bounds的错误。
Prometheus 的监控项,是基于当前时间去查询,那当然查出来的是no data,因为当前时间序列对应的metric根本没有存入到tsdb中。
第一次更改服务器时间,时间序列断裂,当前时间序列对应的metric是no data。
第二次更改服务器时间后,虽然存的是本地时间,但是存入 tsdb 失败了,当前时间序列对应的metric仍然是no data;
解决方法
Prometheus tsdb 的存储路径下存在block和wal目录,其中wal(write ahead logging)目录是用于metric写入 TSDB 的 Head 内存块时,为了防止内存数据丢失先做一次预写日志。当时间序列对应的metric写入 Head 中的chunk,超过 2 小时或 120 样本,即做内存映射,落盘到 block 中。
为了解决这个问题,把 Prometheus 的 tsdb 的存储路径下 wal 目录删除掉,然后把更新时间为非本地时间的 block 目录删掉,以保证 tsdb 最近一次存储的时间序列不会大于当前的时间序列,即可解决上述问题。
时间同步命令:1
2
3yum install -y ntp
ntpdate -u time1.aliyun.com
参考
文章信息
| 时间 | 说明 |
|---|---|
| 2020-10-30 | 初稿 |
| 2020-11-05 | 完稿 |
| 2022-03-04 | 重构 |